Long router queue sizes on the web continue to be a hot networking topic - Jim Gettys has a long interview in ACM queue. Large
unmanaged queues destroy low latency applications - just ask Randell Jessup
A paper like this does
a good job of showing just how bad the situation can be -
experimentally driving router buffering delay from 10ms to ~1000ms on
many common broadband cable and DSL modems. I wish the paper had been
able to show me the range and frequency of that queue delay under normal
conditions.
I'm concerned that decreasing the router buffer size, thereby increasing
the drop rate, is detrimental to the current HTTP/1.x web. A classic
HTTP/1.x flow is pretty short - giving it a signal to backoff doesn't
save you much - it has sent much of what it needs to send already
anyhow. Unless you drop almost all of that flow from your buffers you
haven't achieved much. Further, a loss event has a high chance of
damaging the flow more seriously than you intended - dropping a SYN or
the last packet of the data train is a packet that will have very slow
retry timers, and short flows are comprised of high percentages of these
kinds of packets. non-drop based loss notification like connex/ecn do
less damage but are ineffective again because the short flow is more or
less complete when the notification arrives so it cannot adapt the sending rate.
The problem is all of those other parallel HTTP sessions going on that
didn't get the message. Its the aggregate that causes the buffer build up. Many sites commonly use 60-90 separate uncoordinated TCP flows
just to load one page.
Making web transport more adaptable on this front is a big goal of my
spdy work. When spdy consolidates resources onto the same tcp flow it means the remaining larger flows will be much more
tcp friendly. Loss indicators will have a fighting chance of hitting the
flow that can still backoff, and we won't have windows growing
independently of each other. (Do you like the sound of IW=10 times 90? That's what 90 uncorrelated flows mean. IW=10 of a small number of flows otoh is excellent.).
That ought to keep router queue sizes down and give things like rtcweb a
fighting chance.
It also opens up the possibility of the browser identifying queue growth
through delay based analysis and possibly helping the situation out by
managing inside the browser our bulk tcp download rate (and definitely the
upload rate) by munging the rwin or something like that. If it goes
right it really shouldn't hurt throughput while giving better latency to
other applications. It's all very pie in the sky and down the road, but
its kind of hard to imagine in the current HTTP/1.x world.
Showing posts with label characterization. Show all posts
Showing posts with label characterization. Show all posts
Thursday, December 8, 2011
Tuesday, January 18, 2011
HTTP PSA: beware unpadded content-md5
You don't see a lot of HTTP Content-MD5 response headers, but I just discovered some piece of code that generates unpadded base 64 versions.. i.e. a 22 byte:
Content-MD5: 6Cxy6QbruJs0hrT/P8exaA
I figured HTTP followed MIME rules and required a multiple of 4 characters.. i.e:
Content-MD5: 6Cxy6QbruJs0hrT/P8exaA==
Weirdly, after checking the relevant specs it isn't actually clear to me if the = pad is required. I'm probably missing something obvious. But as this topic generates absolutely 0 google juice, this post is a public service announcement - expect both versions in your clients.
Wednesday, September 1, 2010
Long Out Of Order Queueing Delays
Last week I posted about a kernel patch that records how long out of order TCP packets are kept hidden from userspace while the kernel tries to fill in the necessary holes to create an in-order stream.
These packets are especially frustrating - they have arrived at the host but the application does not have access to them until the kernel can create an in-order stream. Some applications that are really doing messaging over TCP (which might be sensible if you're looking for congestion control, maybe layered security, maybe multiplexing different semantic streams onto one TCP stream and the loss is localized to one of them, etc..) might be capable of moving on with their lives (and their data) more quickly if they had access to the missing sequence numbers. So the question is, how long are these kinds of applications waiting for in-order data when out-of-order data is already at their host?
I ran that code for about 10 days on my desktop which runs typical American broadband with normal RTTs anywhere from 40 to 150ms. The host is even SACK enabled. Here is what I found:
* 38,881 web flows (port 80 or 443)
* 164 flows that contained reordered packets. That is 4.1 per thousand.
* 915K total packets. 18,169 of them reordered. That is 19.8 per thousand.
* The flows with reordering account for just .4% of the flows, but 40% of the total packets. Obviously, the bigger you are the more likely you are to experience a reordering event.. but furthermore small flows sometimes don't reorder at all because any loss that impacts them is more likely to be repaired with an empty window and a timeout.
* If you select for just the .41% of flows that experience reordering a whopping 4.6% of the packets in that flow are reordered on average. Indeed this average flow is pretty large - 2418 packets and 110 of them are delayed due to being out of order. The average size of a flow that did not experience any reordering was just 24 data packets long. The fact that reordering events are such large clusters is probably good news - it likely means that we were seeing big windows of data on the wire and just a small amount of the early packets in that window were lost.. the rest of the window is counted as out-of-order. We want to see big windows in flight - so I'm good with that.
* The average length of a reordered packet is 1424 bytes. Over 97% of these reordered packets are at least 1300 bytes long. This isn't that interesting, but I wrote it down - so here it is.
When I talk about "N packets long" I mean my host received N packets with data in them.. bare acks and control packets are not counted.
So far, that's not too bad. Big flows have this happen all the time. Reordering is basically a pre-requisite for doing any kind of TCP fast recovery in the face of packet loss so it looks good. If we assume that the reordering is due to small packet losses which can be repaired with fast-retransmit algorithms, which seems to make sense, then the out of order problem should be repaired in a little over 1 RTT, right?
Unfortunately, when I plotted the delays incurred they look a lot bigger than the distribution of RTTs I see from my dekstop. A lot bigger.

There is a really long tail on that graph - and it only captures the best 97% of the data points. The longest I saw any packet wait in the reorder queue (and make it out again) was a full 2.5 minutes.
Even though 2.5 minutes is an aberration, the normal cases are still pretty awful. The median time out of order packets spend queued in the kernel while waiting for an in-order stream is 293 milliseconds! Ouch.
Let's zoom in on that graph - this shows the 90% of the packets that waited the shortest amount of time:

That's pretty ugly, you need to budget a full second wait to get 80% of the reordered packets out of their kernel limbo.
It is much much uglier than I expected.
It's not the reordering that bothers me - big reordering runs are to be perfectly expected in the face of a little packet loss and it is good to use that bandwidth while the loss is repaired.
But why is it taking so long to repair?
Friday, August 20, 2010
Characterizing Delays Caused by TCP in-order
If packet N+1 of a TCP flow arrives before packet N, the receiving application does not see any data until packet N gets there. That's what we mean when we say TCP guarantees in-order delivery. That is also true if N+1 through N+100 get there before N - nobody gets through until they can all be delivered in-order.
At least using the BSD socket API.
I got to thinking about the impact of this when discussing a multiplexing implementation of various logical streams on top of TCP. For instance, SPDY and BEEP do things along those lines in order to create efficiencies in terms of more accurate congestion control data. But as someone objected, that creates a certain amount of fate sharing between the different streams that wouldn't exist if they were on separate TCP channels. A packet loss in one of them creates a delay for them both even though throughput might very well be maintained using some variation of fast-retransmit and large windows.
So the question: how often are packets received but the data in them is delayed by he kernel because the stream isn't yet in order? And how long are those delays?
I don't know yet, but I wrote some crude linux kernel patches to find out. When a skb is moved out of the out of order queue a structure with 2 timestamps (in queue, out of queue) is passed to userspace through the netlink connector mechanism. It also reports the total number of received data packets on each TCP stream. That way we can find out, how often and how long.
I'm running the hack on my desktop now.
Tuesday, February 16, 2010
Googling Harder
A while back I mentioned that Google thinks TCP ought to be more aggressive.
I must admit, this matches my own bias. I can barely count the number of applications I have watched wait for network I/O when there was plenty of CPU and idle bandwidth available. It's maddening. Sometimes it's slow start or another aspect of congestion control, sometimes it is outdated things like the nagle algorithm.
Well, Google is back at it with this slide set. (PDF)
They make the argument for increasing the initial cwnd. More provocatively, they argue that the Web has already done so in a defacto way by going to aggressive numbers of independent parallel HTTP connections (where you essentially get new cwnd credits just for opening a new TCP stream). Clever argument. Maybe you want to pace the data after 3 or 4 packets based on the RTT of the handshake - so you don't overrun any buffers un-necessarily.
Frankly, this kind of thing can be implemented on the server side without ever telling the peer. It would make some sense for Google to just do this for a few different values of cwnd on a tiny fraction of their traffic and see if the packet loss rates change and then publish that.
Monday, August 10, 2009
Making the switch
Well that's funny.
Just a few hours after my last post, which suggested that virtio based networking might be getting bested by the not-in-userspace v-bus, Michael Tsirkin posts an in-kernel backend to virtio. Which puts the two on more or less the same procedural footing.
Fire up the benchmarks?
Just a few hours after my last post, which suggested that virtio based networking might be getting bested by the not-in-userspace v-bus, Michael Tsirkin posts an in-kernel backend to virtio. Which puts the two on more or less the same procedural footing.
Fire up the benchmarks?
(not) switching contexts.
a lot of bits have been spilled over virtual network performance in v-bus vs virtio-net/virtio-pci.. (aka alacrity vm vs traditional kvm/qemu).. this includes some pretty sensational(ist?) performance graphs: here.
There are lots of details (and details do matter) but the first-order issue can probably be summed up thusly, from Avi Kivity on lklm:
Perhaps context switching isn't such a minor detail afterall.
There are lots of details (and details do matter) but the first-order issue can probably be summed up thusly, from Avi Kivity on lklm:
The current conjecture is that ioq outperforms virtio because the host side of ioq is implemented in the host kernel, while the host side of virtio is implemented in userspace.
Perhaps context switching isn't such a minor detail afterall.
Tuesday, July 21, 2009
Caution - (S)Low Bridge Ahead
This post will not be satisfying. Someone has posted some great datapoints about virtualized packet forwarding, which is great. But they don't make a lot of sense. Which is not great. Nor is it satisfying.
Oh well, I'm sure there will be a followup sometime in the future.
In this thread, Or Gerlitz posts a new networking type for qemu (and by extension) kvm which are of course popular linux host virtualization packages. The networking type is "raw" and the driver couldn't be more simple - a (v)lan interface on the host is opened with a AF_PACKET socket and all of the packets that appear there are shoved through to the guest interface, and vice versa.
This is a pretty direct way of doing things, but it has the unfortunate side effect that all of the guests and the host itself are aggregated onto one upstream switch port without any kind of bridge, switch, or router in between. This means that unless the upstream switch can do a u-turn when forwarding (and most of them will not), all of the guests and the host are isolated from each other. The normal way of doing things is to attach the guests and host together with a tun/tap socket and run a bridge on host. This bridge will do all the necessary forwarding so that everybody has full connectivity, and it lets you run iptables and ebtables on the host to boot.
That's all well and good, but the really interesting part was the motivation for running around tun/tap/bridge anyhow: the poster runs a test with short udp transmissions over gige.. running it between two real (non-vm) hosts he sees 450K packets per second. The post doesn't mention what hardware is involved, so we'll just take it as a black box baseline. Switching the sender to be a qemu guest with traditional tap/bridge networking it plummets to just 195K. The "raw" interface gets that back up to 240K - which is still a far cry from 450, eh?
Tap mode has 3 times the context switches than the raw version. I don't think I saw a number for the non-vm test. Other than that nothing, including the profiles, really jumps out.
The whole thread is worth reading - but the main data points are here and here
Monday, July 20, 2009
What is eating those Google SYN-ACKs?
In this post, I mentioned google was seeing huge packet loss on syn-acks from their servers. At the time it looked like 2%. That sounded nuts.
It still sounds nuts.
Someone else on the mailing list posted about that, and Jerry Chu of Google confirmed it:
You could imagine why the overall retransmission rate might be higher than the real drop rate due to jitter and various fast retransmit algorithms that might retransmit things that just hadn't been acknowledged quite yet. Even SYNs might be dropped at the host (instead of the network) due to queue overflows and such.. but we're talking about SYN-ACKs from busy servers towards what one would expect would be pretty idle google-searching clients. And these SYN-ACKs have giant timeouts (3 seconds - which is why Jerry was writing in the first place) so it certainly isn't a matter of over-aggressive retransmit. The only explanation seems to be packet loss. At greater than 1%
wow.
This probably has more to do with the global nature of google's audience than anything else. But still, TCP can really suck at loss rates that high. It must be very different than the desktop Internet I know (which is a fair-to-middlin cable service, not a fancy Fiber-To-The-Home setup which is becoming more common.)
I wonder exactly where those losses happen.
It still sounds nuts.
Someone else on the mailing list posted about that, and Jerry Chu of Google confirmed it:
Our overall pkt retransmission rate often goes over 1%. I was
wondering if SYN/SYN-ACK pkts are less likely to be dropped
by some routers due to their smaller size so we collected traces
and computed SYN-ACK retransmissions rate on some servers.
We confirmed it to be consistent with the overall pkt drop rate,
i.e., > 1% often.
You could imagine why the overall retransmission rate might be higher than the real drop rate due to jitter and various fast retransmit algorithms that might retransmit things that just hadn't been acknowledged quite yet. Even SYNs might be dropped at the host (instead of the network) due to queue overflows and such.. but we're talking about SYN-ACKs from busy servers towards what one would expect would be pretty idle google-searching clients. And these SYN-ACKs have giant timeouts (3 seconds - which is why Jerry was writing in the first place) so it certainly isn't a matter of over-aggressive retransmit. The only explanation seems to be packet loss. At greater than 1%
wow.
This probably has more to do with the global nature of google's audience than anything else. But still, TCP can really suck at loss rates that high. It must be very different than the desktop Internet I know (which is a fair-to-middlin cable service, not a fancy Fiber-To-The-Home setup which is becoming more common.)
I wonder exactly where those losses happen.
Tuesday, July 14, 2009
Google Thinks TCP should be more Aggressive by Default
Really interesting post from Jerry Chu of Google. He says Google has data which shows that we ought to lower the initial RTO, increase the initial CWND, drop the min RTO, and reduced the delayed ack time out in TCP.
Based on my own anecdotal data, I've done stuff like that in products I've worked on. Let's face it - 3 seconds is a freaking eternity. Processors, networks, and busses have all scaled but these constants remain the same. Jerry says Google has data that shows this is important. As the google data set is no doubt much more extensive than any I worked with, that's a really welcome post.
Probably the most important data point Jerry shares is that "up to a few percentage points" in his data set exhibit a SYN-ACK retransmission from the google servers. Wow. (at least) 1 in 50 syn-acks needs to be retransmitted? That's not my experience at all, and if true on google scale it is absolutely fascinating. Are they generally seeing 2% packet loss on google tx? There's no way that they are seeing that.. google would appear to suck! So what's going on... ? Why is syn-ack rexmitted more than anything else? (and I'm assuming they are indeed lost, because otherwise lowering the timeout wouldn't be the right remedy..)
Monday, November 24, 2008
Dallas One-Wire Temperature Network - Followup
I managed to get the little 5-volt 1 wire network I mentioned earlier, built up and running. Even fishing the wires wasn't too hard, "thanks" to the distinct lack of insulation in some of my walls. I did have to patch a section of the main run (I used a 100 ft run with short stubs to hold the sensors) when I put a staple through the cable while attaching it to the rafters. Doh!
The graphs make it look colder inside than it really is as I purposely put the sensors in all the cold spots. The kitchen has a zoned radiator that we can use if we are hanging out there, and the wild swings in my office are just the result of me closing the door when I'm not in there. The dining room is the warmest and I will eventually add a sensor there to put an upper bound on the data.
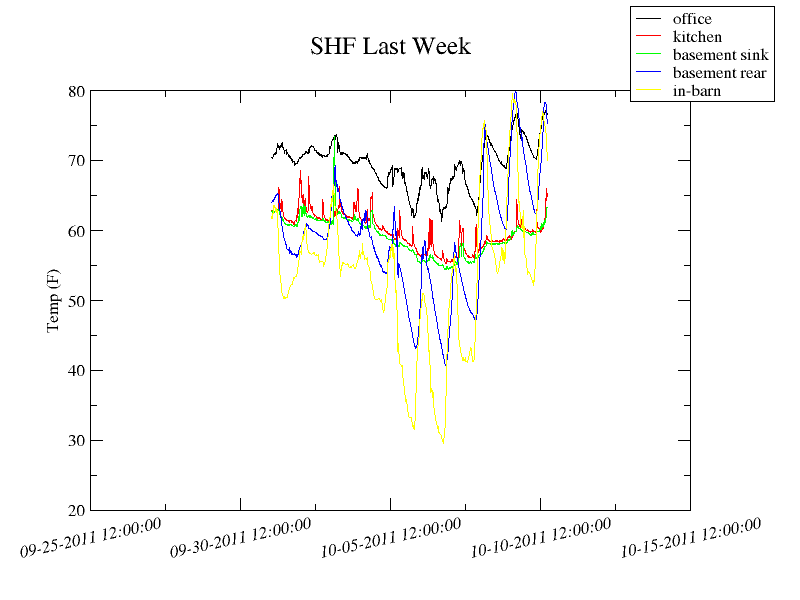
I didn't really like any of the pre-canned software options for it, so I rolled my own using xmgrace, digitemp, rsync, and cron. This is pretty crude, but it is a decent placeholder.
The graphs make it look colder inside than it really is as I purposely put the sensors in all the cold spots. The kitchen has a zoned radiator that we can use if we are hanging out there, and the wild swings in my office are just the result of me closing the door when I'm not in there. The dining room is the warmest and I will eventually add a sensor there to put an upper bound on the data.
I didn't really like any of the pre-canned software options for it, so I rolled my own using xmgrace, digitemp, rsync, and cron. This is pretty crude, but it is a decent placeholder.
Tuesday, September 23, 2008
Simulating Wireless Networks With Linux
I have been working on enhancing network performance for the upcoming Firefox on Mobile. I jokingly refer to this work as "finding useful things to do with latency" as the browser is targeted at cell phone networks. These networks have latencies of hundreds, sometimes over a thousand, milliseconds.
From time to time I hope to talk on this blog about interesting things I have found or done while looking into this.
One of the cool things I consed up in the effort is a python script to emulate one of these networks over localhost. Just run the script, along with an XML file that describes the network you're looking to simulate, and then you can run any networking application you want across localhost to measure the impact of any potential changes you want to make.
The script relies on netem and ifb. In that sense, it doesn't really add anything fundamental by itself. Those are outstanding, but poorly understood tools.
By rolling that together in a script, and providing XML profiles for 3G, edge, bluetooth, evdo, hspd, and gprs wireless networks I was able to provide a meaningful testbed for evaluating default preferences for concurrency and pipeline depth, as well as the impact of changes to DNS pre-fetching and the pipelining implementation. All good stuff. Some of them need their own posts.
If you're interested in the tool - this is the release announcement. It is bundled as part of my local copy of the firefox development tree, but the tool is easily separable from that for use on something else.
Friday, April 18, 2008
Measuring performance of Linux Kernel likely() and unlikely()
A little while back I wrote about how prominent likely() and unlikely() are in the Linux kernel, and yet I could not find any performance measurements linked to them.
Today I made some measurements myself.
But first a quick review - likely and unlikely are just macros for gcc's __builtin_expect(), which in turn allows the compiler to generate code compatible with the target architecture's branch prediction scheme. The GCC documentation really warns against using this manually too often:
My methodology was simple, I choose several benchmarks commonly used in kernel land and I ran them against vanilla 2.6.25 and also against a copy I called "notlikely" which simply had the macros nullified using this piece of programming genius:
The tests I ran were lmbench, netperf, bonnie++, and the famous "how fast can I compile the kernel?" test.
The test hardware was an all 64 bit setup on a 2.6Ghz core-2 duo with 2GB of ram and a SATA disk. Pretty standard desktop hardware.
The core 2 architecture has a pretty fine internal branch prediction engine without the help of these external hints. But with such extensive use of the macros (3500+ times!), I expected to see some difference shown by the numbers.
But I didn't see any measurable difference. Not at all.
Not a single one of those tests showed anything that I wouldn't consider overlapping noise. I had 3 data points for each test on each kernel (6 points per test) and each test had several different facets. Out of dozens of different facets, there wasn't a single criteria where the measurement was always better or worse on one kernel.
And this disappoints me. Because I like micro optimizations damn it! And in general this one seems to be a waste of time other than the nice self documenting code it produces. Perhaps the gcc advice is correct. Perhaps the Core-2 is so good that this doesn't matter. Perhaps there is a really compelling benchmark that I'm just not running.
I say it is a waste in general because I am sure there are specific circumstances and code paths where this makes a measurable difference. There certainly must be a benchmark that can show it - but none of these broad based benchmarks were able to show anything useful. That doesn't mean the macro is over used, it seems harmless enough too, but it probably isn't worth thinking too hard about it either.
hmm.
Today I made some measurements myself.
But first a quick review - likely and unlikely are just macros for gcc's __builtin_expect(), which in turn allows the compiler to generate code compatible with the target architecture's branch prediction scheme. The GCC documentation really warns against using this manually too often:
You may use __builtin_expect to provide the compiler with branch prediction information. In general, you should prefer to use actual profile feedback for this (-fprofile-arcs), as programmers are notoriously bad at predicting how their programs actually perform. However, there are applications in which this data is hard to collect. The kernel certainly makes liberal use of it. Accroding to LXR 2.6.24 had 1608 uses of likely and 2075 uses of unlikely in the code. LXR didn't have an index of the just released 2.6.25 yet - but I'd bet it is likely to be more now.My methodology was simple, I choose several benchmarks commonly used in kernel land and I ran them against vanilla 2.6.25 and also against a copy I called "notlikely" which simply had the macros nullified using this piece of programming genius:
The tests I ran were lmbench, netperf, bonnie++, and the famous "how fast can I compile the kernel?" test.
The test hardware was an all 64 bit setup on a 2.6Ghz core-2 duo with 2GB of ram and a SATA disk. Pretty standard desktop hardware.
The core 2 architecture has a pretty fine internal branch prediction engine without the help of these external hints. But with such extensive use of the macros (3500+ times!), I expected to see some difference shown by the numbers.
But I didn't see any measurable difference. Not at all.
Not a single one of those tests showed anything that I wouldn't consider overlapping noise. I had 3 data points for each test on each kernel (6 points per test) and each test had several different facets. Out of dozens of different facets, there wasn't a single criteria where the measurement was always better or worse on one kernel.
And this disappoints me. Because I like micro optimizations damn it! And in general this one seems to be a waste of time other than the nice self documenting code it produces. Perhaps the gcc advice is correct. Perhaps the Core-2 is so good that this doesn't matter. Perhaps there is a really compelling benchmark that I'm just not running.
I say it is a waste in general because I am sure there are specific circumstances and code paths where this makes a measurable difference. There certainly must be a benchmark that can show it - but none of these broad based benchmarks were able to show anything useful. That doesn't mean the macro is over used, it seems harmless enough too, but it probably isn't worth thinking too hard about it either.
hmm.
Saturday, April 5, 2008
Linux Selective Acknowledgment (SACK) CPU Overhead
Last year I tossed an e-mail from the Linux kernel networking list in my "projtodo" folder.
The mail talked about how the Linux TCP stack in particular, and likely all TCP stacks in general, likely had an excessive-CPU attack exposure when confronted with malicious SACK options. I found the mail intriguing but unsatisfying. It was well informed speculation but didn't have any hard data, nor was there any simple way to gather some. Readers of the other posts on this blog will know I really dig measurements. The issue at hand was pretty obviously is a problem - but how much of one?
A few weeks ago I had the chance to develop some testing code and find out for myself - and IBM DeveloperWorks has published the summary of my little project. The executive summary is "its kinda bad, but not a disaster, and hope is on the way". There is had data and some pretty pictures in the article itself.
The coolest part of the whole endeavor, other than scratching the "I wonder" itch, was getting to conjure up a userspace TCP stack from raw sockets. It was, of course, woefully incomplete as it was just meant to trigger a certain behavior in its peer instead of being generally useful or reliable - but nonetheless entertaining.
Thursday, April 3, 2008
Linux Kernel - likely() not measured?
The other day on kernelnewbies, the able Robert Day wondered whether or not anyone had quantified the effects of the likely() and unlikely() macros scattered all over the Linux kernel.
He received no less than 5 replies telling him how the macros worked. (If you are curious, this is the best explanation) - but not a single piece of measurement or other characterization.
LXR shows over 3500 uses of those macros in the kernel, and nobody has any data for any scenario? Wowzers.
Doing before/after benchmarks with those macros changed to nops would be an interesting project. Could use the usual suspects of linux kernel performance enhancements to test (lmbench, compile test, some kind of network load generator, etc..)
Comments with pointers to data would be cool.
Tuesday, March 4, 2008
Calgary IOMMU - At What Price?
The Calgary IOMMU is a feature of most IBM X-Series (i.e. X86_64) blades and motherboards. If you aren't familiar with an IOMMU, it is strongly analogous to a regular MMU but applied to a DMA context. Their original primary use was for integrating 32 bit hardware into 64 bit systems. But another promising use for them is enforcing safe access in the same way an MMU can.
In normal userspace, if a program goes off the rails and accesses some memory it does not have permissions for a simple exception can be raised. This keeps the carnage restricted to the application that made the mistake. But if a hardware device does the same thing through DMA, whole system disaster is sure to follow as nothing prevents the accesses from happening. The IOMMU can provide that safety.
An IOMMU unit lets the kernel setup mappings much like normal memory page tables. Normal RAM mappings are cached with TLB entries, and IOMMU maps are cached TCE entries that play largely the same role.
By now, I've probably succeeded in rehashing what you already knew. At least it was just three paragraphs (well, now four).
The pertinent bit from a characterization standpoint is a paper from the 2007 Ottawa Linux Symposium. In The Price of Safety: Evaluating IOMMU Performance Muli Ben-Yehuda of IBM and some co-authors from Intel and AMD do some measurements using the Calgary IOMMU, as well as the DART (which generally comes on Power based planers).
I love measurements! And it takes guts to post measurements like this - in its current incarnation on Linux the cost of safety from the IOMMU is a 30% to 60% increase in CPU! Gah!
Some drill down is required, and it turns out this is among the worst cases to measure. But still - 30 to 60%! The paper is short and well written, you should read it for yourself - but I will summarize the test more or less as "measure the CPU utilization while doing 1 Gbps of netperf network traffic - measure with and without iommu". The tests are also done with and without Xen, as IOMMU techniques are especially interesting to virtualization, but the basic takeaways are the same in virtualized or bare metal environments.
The "Why so Bad" conclusion is management of the TCE. The IOMMU, unlike the TLB cache of an MMU, only allows software to remove entries via a "flush it all" instruction. I have certainly measured that when TLBs need to be cleared during process switching that can be a very measurable event on overall system performance - it is one reason while an application broken into N threads runs faster than the same application broken into N processes.
But overall, this is actually an encouraging conclusion - hardware may certainly evolve to give more granular access to the TCE tables. And there are games that can be played on the management side in software that can reduce the number of flushes in return for giving up some of the safety guarantees.
Something to be watched.
Friday, February 15, 2008
SLA as medians, percentiles, or averages - as told by Amazon's Dynamo
I am going to recommend another published paper because of how it talks about characterizing its own performance. That's not the point of the paper, but I found it really interesting anyhow.
The paper is Dynamo: Amazon’s Highly Available Key-value Store, by a number of good folks over at Amazon.com (including the CTO Werner Vogels). It was published in the peer reviewed SOPS '07.
The bulk of the paper is about Dynamo, which apparently is a home grown key-value storage system that has a lot of inherent replication, scalability, and reliability. A good read.
Instead of the big picture I wanted to focus on a detail. The paper rejects the notion of defining SLAs with median expectations. Instead, Dynamo uses 99.9 percentiles. (It also rejects using means, but that is pretty nonsensical anyhow, isn't it?). The central idea is that the SLA defines acceptable usage for all users - not just for half of them (the median).
This matters in real life in a very real way. There is normally one version of an operation and then an ala carte menu of choices they might layer on that.. lots of folks use the vanilla version, but if 10, 20, 30, or even 40 percent of users are using some features that require extra processing - they are totally left out of the SLA. The canonical Amazon case is a user with a very long purchasing history - an important case but not the average case. 99.9 installs a threshold for a reasonable definition of "everybody" while still leaving room for the occasional pathological case. The authors point out that for more money you can have more nines, but the law of diminishing returns certainly applies.
You have to wonder if after today's S3 outage they wish they had bought another nine or two ;) (I have no reason to think that had anything to do with Dynamo - I'm just poking fun - what Amazon has built for S3/EC2 is very impressive)
I was happily nodding along as I read the paper when this came up:
But, I was too harsh. I hadn't internalized what shifting from the 50th percentile to the 99.9th really meant. The value isn't representative of what the typical user will see - it is representative of the worst you can stomach. In effect, it loses its marketing value - which is how a lot of SLAs are used in the real world.
The Dynamo paper backs this up. Figure 4 shows both the average and 99.9 percentiles for both reads and writes. average reads ran around 15ms, writes around 25. 99.9 percentiles were respectively in the 150 and 250 neighborhoods. This all makes much more sense, especially when dealing with disk drives.
In the end, I think you need more than one datapoint in order to make an effective characterization. Amazon clearly wouldn't be happy if everybody was seeing 150ms latencies - though they can stomach it if literally it is a one in a thousand kind of occurrence.
Maybe SLAs should be expressed as 4 tuples of 25/50/75/99.9 .. I've developed benchmarks that way and felt that helped keep the subsequent optimizations honest.
Even 90/99.9 is mostly what you need to keep a cap on the outliers while still getting a feel for what somebody is likely to see.
The paper is Dynamo: Amazon’s Highly Available Key-value Store, by a number of good folks over at Amazon.com (including the CTO Werner Vogels). It was published in the peer reviewed SOPS '07.
The bulk of the paper is about Dynamo, which apparently is a home grown key-value storage system that has a lot of inherent replication, scalability, and reliability. A good read.
Instead of the big picture I wanted to focus on a detail. The paper rejects the notion of defining SLAs with median expectations. Instead, Dynamo uses 99.9 percentiles. (It also rejects using means, but that is pretty nonsensical anyhow, isn't it?). The central idea is that the SLA defines acceptable usage for all users - not just for half of them (the median).
This matters in real life in a very real way. There is normally one version of an operation and then an ala carte menu of choices they might layer on that.. lots of folks use the vanilla version, but if 10, 20, 30, or even 40 percent of users are using some features that require extra processing - they are totally left out of the SLA. The canonical Amazon case is a user with a very long purchasing history - an important case but not the average case. 99.9 installs a threshold for a reasonable definition of "everybody" while still leaving room for the occasional pathological case. The authors point out that for more money you can have more nines, but the law of diminishing returns certainly applies.
You have to wonder if after today's S3 outage they wish they had bought another nine or two ;) (I have no reason to think that had anything to do with Dynamo - I'm just poking fun - what Amazon has built for S3/EC2 is very impressive)
I was happily nodding along as I read the paper when this came up:
Dynamo is built for latency sensitive applications that require at least 99.9% of read and write operations to be performed within a few hundred millisecondsMy initial reaction was not charitable: Whoa - that's not really setting the bar very high, is it guys? Hundreds of millis to read and write a key/value pair? You say yourself in the introductory pages that these services are often layered on top of each other! Sure, it is more latency sensitive than an overnight data warehouse operation, but that's hardly an impressive responsiveness threshold.
But, I was too harsh. I hadn't internalized what shifting from the 50th percentile to the 99.9th really meant. The value isn't representative of what the typical user will see - it is representative of the worst you can stomach. In effect, it loses its marketing value - which is how a lot of SLAs are used in the real world.
The Dynamo paper backs this up. Figure 4 shows both the average and 99.9 percentiles for both reads and writes. average reads ran around 15ms, writes around 25. 99.9 percentiles were respectively in the 150 and 250 neighborhoods. This all makes much more sense, especially when dealing with disk drives.
In the end, I think you need more than one datapoint in order to make an effective characterization. Amazon clearly wouldn't be happy if everybody was seeing 150ms latencies - though they can stomach it if literally it is a one in a thousand kind of occurrence.
Maybe SLAs should be expressed as 4 tuples of 25/50/75/99.9 .. I've developed benchmarks that way and felt that helped keep the subsequent optimizations honest.
Even 90/99.9 is mostly what you need to keep a cap on the outliers while still getting a feel for what somebody is likely to see.
Thursday, January 31, 2008
AjaxScope Paper Provides Javascript Characterization
Emre Kıcıman and Benjamin Livshits from Microsoft Research present some interesting data in their SOPS paper - AjaxScope: A Platform for Remotely Monitoring the Client-Side Behavior of Web 2.0 Applications.
The paper is mostly about AjaxScope, a neat insturmentation and profiling tool for JavaScript.
What I want to highlight, though, are some of the measurements they present for both IE (6 and 7) as well as Firefox (2). This is real data in a refereed journal of the ACM, not a Gartner-style whitepaper.
Among the interesting nuggets are IE's 35x slower performance in String cat operations, and Firefox's 4x slower Array join execution time. The authors also put the intrinsics into context by measuring the performance of common portal pages - IE beats Firefox on msn.com, but Firefox turns the tables on Yahoo!.
Lots more interesting data, and a useful tool, in the paper. Read it.
Saturday, January 19, 2008
Web Syndication Format Market Share
For quite a while my todo list has had an instruction to find and characterize the popularity of RSS vs ATOM . Which syndication format is more popular?
Atom seems on the face of it to be a better format than RSS, but some of what it addresses are not really wide spread problems for operations. Market share will tell if it was a solution looking for a real problem or not. Atom is about 2 years old - and it is pretty common to see atom feeds available around the net now.
Measuring the breakdown among my own set of feeds that I read isn't terribly useful. I have a bias in my selections - it isn't like measuring my connectivity or transport properties where I am representative as a sample.
For the record: I have 112 feeds, 54 of them in atom and 58 in some kind of rss.
The best information I could find was from syndic8.com. But frankly, it wasn't very satisfying. The site didn't feel very complete, and in the end only showed essentially the ratio between RSS and Atom offerings. They listed about 1/2 a million feeds - 82% of which were some flavor of RSS.
What I want to know is the ratio between active usages (i.e. fetches) of the two formats. Lots of sites offer both formats - but which do users actually consume?
Feedburner clearly has this info - but I couldn't find it published anywhere.
Does anybody have more information?
Thursday, January 17, 2008
Characterization Zealots Unite!
The eponymous Kode Vicious over at ACM's Queue magazine has an excellent rant on the value of measuring instead of assuming. I read it in print a ways back, now that it is in digital form it deserved a blog shoutout.
Subscribe to:
Posts (Atom)